Tag: Maths

Statistical Investigation

LI: to create diagram about the top 6 rivers in Auckland.

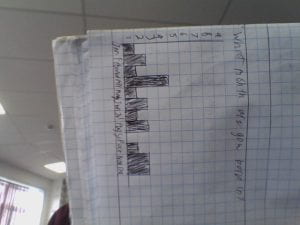
Our math group created a diagram which shows the top six rivers in Auckland from smallest to largest. We used our collaborative skills to find out the data of each river. We put these rivers in this order from shortest to longest Whau River 6km, Puhoi, Tamaki River, Waitakere River, Hoteo River, Wairoa River.
We used our knowledge to come to the conclusion on what river is the longest out of the 6 rivers in Auckland, which is Wairoa River what is 65km.

I found this activity enjoyable because I liked finding what river was the longest in New Zealand out of the top 6.

How Scientist Live/survive in The South Pole

I reasearched how scientist in the south pole live and survive.

First I searched what temperature it is in the south pole, it is -49.3°C.

Next I searched what scientist in the south pole eat, I found that they eat “Sledging Biscuits”.

Lastly I reasearched how do scientist at south pole survive?, I found it said by staying on the station, the station is just like an hotel, except there aren’t any staff to do things for you.

I liked this task and I enjoyed it, but I think I need to get better at doing my reasearch.

Temperature

I learnt about temperature.

First Miss white told us what its measured in, its measured in degrees, but its also called degrees .c.

Next I had to make a copy of a google docs where it had questions like ” The temperature falls by 5 degrees from 8 degrees the new temperature?” and I had to answer it, I also learnt rise means add and falls means takeaways.

Lastly I made a DLO talking about facts and adding a lot information to it for example what the hottest place on earth is and what the coldest place on earth is.

I like this task and I enjoyed learning about temperature, but I think I need to get better at answering the questions.

Times

I learnt how to read time.

First Miss White drew an time on the whiteboard, we had to try find out the right answer and write it on the whiteboard.

Then I had to make an slide show showing a picture of a clock, with times on it.

Lastly I told what time all of them were, and all the answers

I liked this task because I learnt more about how to read time, and I think I’m good at telling the time, but I think I need to get better at explaining them on my slide.

Statistics

I learnt how to make statistics for an jump distance.

First I had to learn how to made an table, what is tells the date or times of somthing on one side and a scatter graph,  is where you place dots on to tells what date or time it was and how far they jumped, for example if you jumped 1.3 you will have to mark it where 1.3 it.

Then me and my team had to jump 10 time and measure it, one person had to be the jumper the other had to be the person that places the cone on the landing then lastly one person had to measure the distance with a rular and write it down on their book.

I enjoyed this task beause I learnt more on distance and I think I’m good at it, but I think I need to improve on how to explain on how to make an table.

Perimetre

I learnt perimetre.

First I learnt what a perimetre is, perimetre is a strategy use when measuring, but its used to calculate the perimeter.

Then I had to make a DLO explaining how big the school field is on google maps, I also had to explain perimeter of the field.

Lastly I made the DLO pretty.

I liked this task and I think I’m good at it, but I think I need to get better at explaining the strategy.t

Length

I measured length.

Length is to measure the longes or highes part of somthing.

First Miss White told us what length is measured in, it is measured in mm (millimeters) cm (centimeters) m (meters) and km (kilometers).

Then I had to complete a task where I had to find objects and measure the hightest part of it and say what I measured it in, for example I measured a chair a table in cm and the lengh was 91 cm.

Lastly I had to make a DLO explaning what length is and how to measure length.

Solvemoji

I did Solvemoji.

First I made a slide then played a game of Solvemoji.

Then I got the answers and added them all and found the answer.

Lastly I put the answer on a slide and put a pic of the game I played and sloved.

I liked playing Solvemoji and I think I’m good at it, but I think I need to find the answer faster.


Startistics

This week I did statistics.

First I got information from my tallys, for example I got the information of who can ride a bike and how many people live in your house.

Then when I get all the information I wrote it in my book for example i wrote “I can see feb has 2 people born in it” or “I can see 2o can ride a bike”.

I liked this task because Iiked learning about statistic and I think I’m good at making the tallys, but I think I need to improve on drawing graphs.

Statistics

I learnt my Statistics.

First the class had to make their own tally, we had to answer 4 questions.

Then my team and I had to do fractions.

Next Miss white gave us a lesson about Statistics, she told us more about statistics.she then told us to do a task where we had to draw a tally in our books.

Lastly, I finished the task.

 I liked this task and I think I’m good at making tally’s, but I think I need to improve on nothing.